Comparison: Cloud Cover vs. Latitude
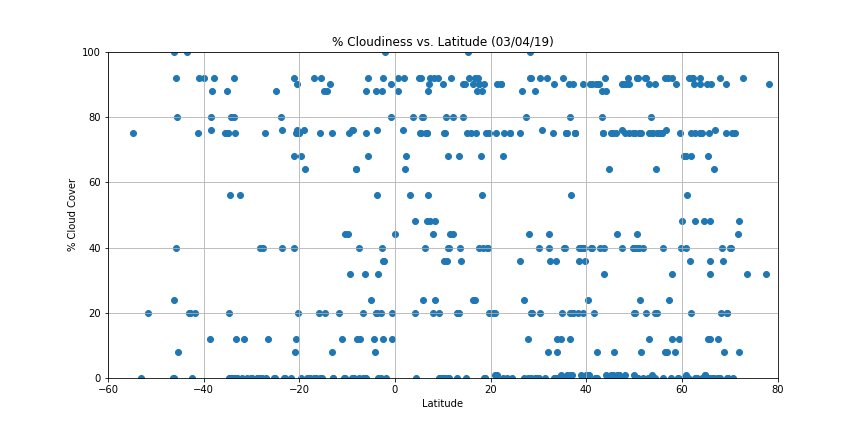
The scatter plot shows that the cloud cover versus latitude. There is no recogizable correlation. Some 'bands' that appera in the plot are due the fact that the reporting (which is more of an estimate, not an exact measurement) tends to cluster around this data.